 Tuna Industrial Platform
Guide
How to calculate OEE without hiding production losses
A practical guide to calculating OEE with visible assumptions, honest denominators, first-pass quality and loss categories that do not hide production losses.
How to calculate OEE without hiding production losses
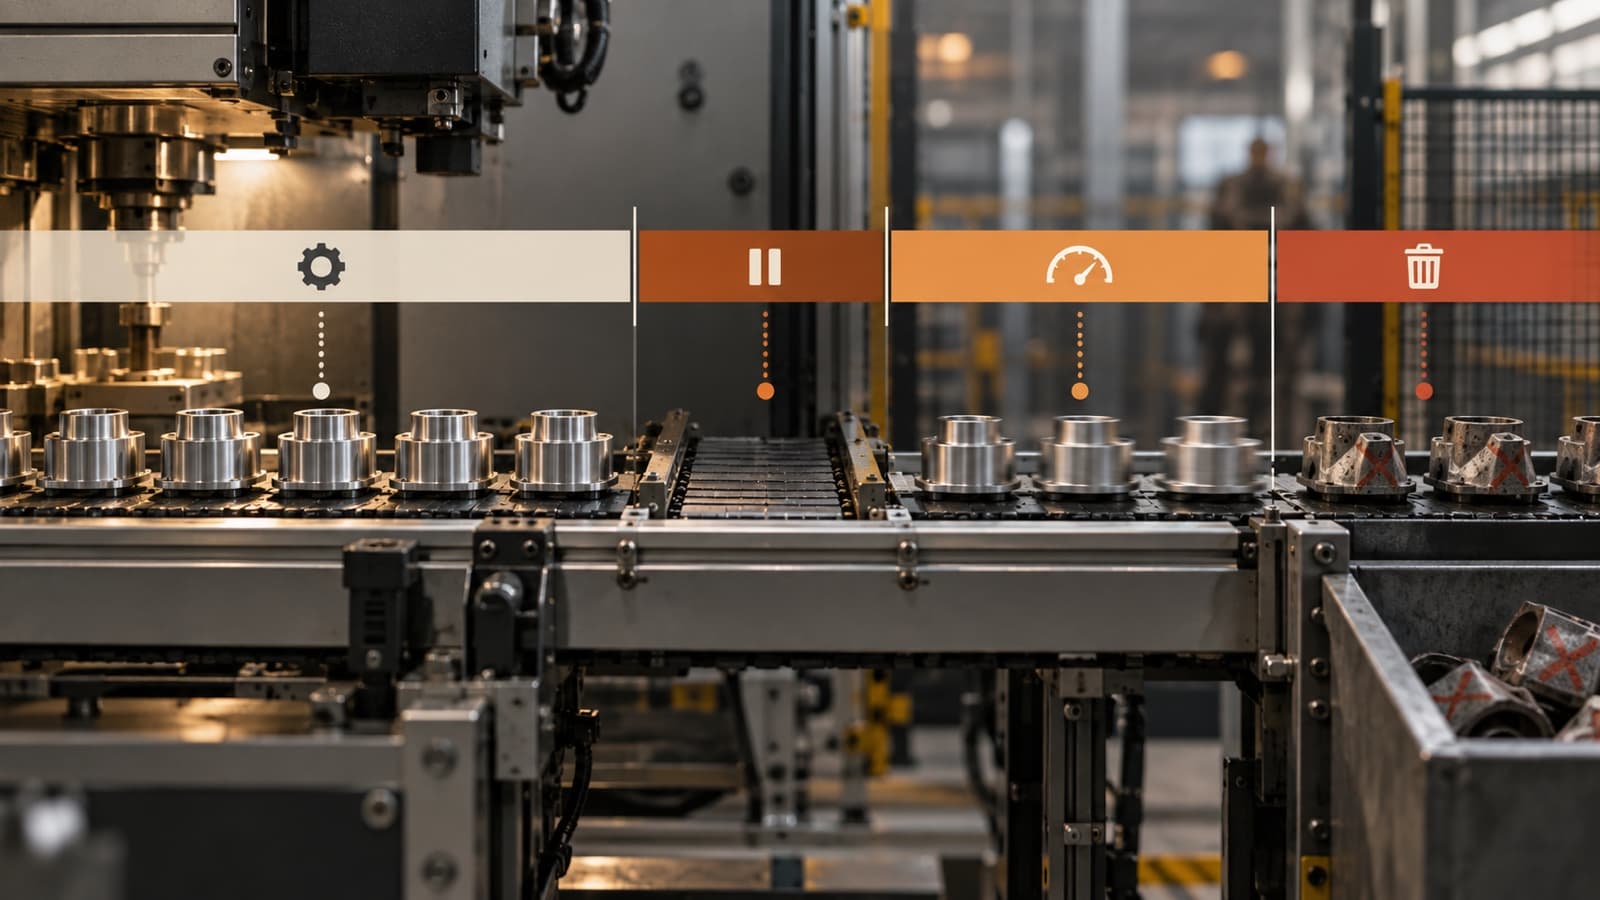
OEE should be calculated so that every loss remains visible: start with planned production time, subtract all stops inside that window to get run time, use a realistic ideal cycle time for performance, count only first-pass good output for quality, and report Availability, Performance and Quality beside the final percentage. The calculation is not a way to make a line look efficient. It is a way to show where planned production time became stop time, slow running, scrap or rework.
This guide is a practical companion to what is OEE. The pillar explains what OEE is. This article explains the calculation choices that keep losses from being hidden. The treatment of unscheduled time is the main boundary between OEE, TEEP and capacity utilization, so this article keeps the OEE boundary explicit instead of blending the metrics.
Formula and definitions
Availability = Run Time / Planned Production Time
Performance = (Ideal Cycle Time x Total Count) / Run Time
Quality = Good Count / Total Count
OEE = Availability x Performance x Quality
The single-step audit check is OEE = (Good Count x Ideal Cycle Time) / Planned Production Time. The single-step form is mathematically helpful, but it is not the best management view because it hides the factor that caused the loss. Two lines can both report 72 percent OEE while one is dominated by changeovers and the other by speed loss.
Planned Production Time is the period when the equipment was scheduled and expected to produce. It should be defined from the production plan before the result is known. Breaks, no-order windows and maintenance that are genuinely outside production intent may be excluded. Material waits, delayed changeovers, quality holds and operator shortages should not be removed after the shift merely because they are uncomfortable.
Run Time is Planned Production Time minus Stop Time. Stop Time includes breakdowns, blocked or starved conditions, material shortages, changeovers, cleaning and adjustment if they occur inside planned production time. The stop may be justified, but it is still a loss of productive time within the OEE boundary. This also gives operators a cleaner decision rule: record whether the event stopped production inside the planned window, then let the later review decide whether the reason was preventable, acceptable or a planning issue.
Ideal Cycle Time is the fastest sustainable, technically realistic cycle time for the product and equipment under normal conditions. It should not be last month's average speed or a comfortable reporting target. Good Count should mean first-pass good output. Reworked product may ship later, but it was not first-pass good output for the OEE calculation.
Step 1. Freeze the denominator before performance is known
The simplest way to hide production losses is to shrink planned production time after the shift. If a team removes waiting for material, late tooling or a quality hold from the denominator after seeing the result, the OEE score rises without one extra good part. The factory learns less precisely when the report looks better.
A stronger rule is to define planned production time from the schedule and then classify every loss inside that window. This does not blame the operator for missing material. It keeps the loss visible for the planning, supply, quality or maintenance group that can act on it. The question is not whether the interruption was justified. The question is whether the line was expected to produce.
Step 2. Keep planned and unplanned stops visible
Many sites count breakdowns but quietly remove changeovers. That is understandable because changeovers are planned work, but it weakens OEE. A changeover inside planned production time consumes capacity. It should be visible as Availability loss, then separated by reason code so it is not confused with random breakdown.
The same logic applies to cleaning, warmup, missing pallets, missing labels, quality inspection holds and blocked downstream equipment. If the event prevents production during a scheduled production window, it belongs in the loss structure. OEE is most useful when it shows the whole loss tree and lets teams decide which branch deserves improvement.
Step 3. Govern ideal cycle time
Performance is highly sensitive to ideal cycle time. A standard that is too slow rewards underperformance. A standard that is too aggressive creates permanent false loss. Each ideal cycle time should have an owner and a source: engineering validation, approved process recipe, machine capability study or controlled master data. Changes should be logged with the reason. On multi-product lines, use product-level or product-family cycle times rather than one comfortable average. Otherwise a shift with an easier product mix can appear to improve performance even when the line itself has not changed.
Performance above 100 percent should not be celebrated without review. It usually means one of three things: the ideal cycle time is too slow, the count is wrong, or the run time is wrong. The correct response is to investigate the measurement system before turning the result into a success story.
Step 4. Treat quality as first-pass quality
Quality = Good Count / Total Count. For OEE, Good Count should include only units that meet requirements the first time. Rework may be commercially useful, but it consumes time and attention outside the normal flow. Counting rework as good output hides quality loss and makes the OEE number less helpful for production improvement.
A practical test is simple: if rework doubles but final shipments stay the same, should the OEE Quality factor change? For a first-pass production metric, the answer is yes. If the local calculation says no, the calculation is measuring shipment completion rather than equipment effectiveness.
Worked example with visible assumptions
Assume one packaging line runs one product for an 8-hour shift. Shift length is 480 minutes. Fixed breaks and planned non-production time outside the production plan total 60 minutes, so Planned Production Time is 420 minutes. During that window the line spends 35 minutes on changeover and 45 minutes on breakdowns and short stops. Run Time is 420 - 35 - 45 = 340 minutes. Ideal Cycle Time is 1.8 seconds per unit. Total Count is 10,400 units. First-pass Good Count is 10,000 units.
Availability = 340 / 420 = 0.8095, or 81.0 percent.
Performance = (1.8 seconds x 10,400) / (340 minutes x 60 seconds) = 18,720 / 20,400 = 0.9176, or 91.8 percent.
Quality = 10,000 / 10,400 = 0.9615, or 96.2 percent.
OEE = 0.8095 x 0.9176 x 0.9615 = 0.714, or 71.4 percent.
The single-step check gives the same result: (10,000 x 1.8) / (420 x 60) = 18,000 / 25,200 = 71.4 percent. The factors show that the main issue is Availability. The plant lost 80 minutes inside planned production time: 35 minutes from changeover and 45 minutes from breakdowns and short stops. That split matters because the first bucket points toward preparation, setup and planning decisions, while the second bucket points toward maintenance, minor-stop analysis and flow stability.
Common ways losses disappear
The first pattern is denominator shrinkage. The team removes awkward time categories from planned production time after the fact. The fix is a frozen production-time rule and separate loss codes.
The second pattern is speed normalization. The ideal cycle time is relaxed until performance looks acceptable. The fix is governed master data and review of any performance result above 100 percent.
The third pattern is rework absorption. Reworked output is counted as good. The fix is to align OEE quality with first-pass yield and track rework separately.
The fourth pattern is over-aggregation. A plant-level OEE average hides different losses on different assets. The fix is to report the summary only with line, asset and loss-driver detail.
Boundary with TEEP and capacity utilization
OEE begins with planned production time. It does not penalize a line for hours when the business did not schedule it to run. TEEP expands the denominator to all calendar time by adding utilization. Capacity utilization usually compares actual output with available, rated or business-defined capacity. These metrics answer different questions. Use OEE to ask how planned production time performed. Use TEEP to ask how much of all time became good output. Use capacity utilization to ask whether available business capacity is being used.
Practical controls
Write a local OEE standard. It should define planned production time, stop thresholds, ideal cycle time ownership, first-pass good count, rework treatment and aggregation rules. Keep reason codes simple enough that operators can use them consistently. Separate measurement governance from improvement responsibility so that teams are not tempted to improve the number by changing definitions.
Add a short data-governance check before each review: was the planned window frozen before the result was known, did the product recipe match the production order, did any manual count adjustment have a reason, and were rework units kept out of first-pass Good Count? These checks do not make the metric more complicated. They make the number less negotiable.
Review outliers. Sudden OEE jumps after master-data edits, zero minor stops on a manual line, identical OEE across different products and performance above 100 percent are prompts to inspect the measurement system. A useful OEE process is sometimes uncomfortable because it preserves losses that teams would rather explain away.
Conclusion
A loss-visible OEE calculation keeps the denominator honest, keeps stops inside the scheduled window, uses realistic ideal cycle times and counts only first-pass good output. The goal is not a prettier score. The goal is a loss structure clear enough for better work to begin.
Related articles
Source and governance note
The formulas in this draft use the common three-factor OEE model: Availability, Performance and Quality. The inspected OEE.com calculation page states the calculation forms for Good Count, Ideal Cycle Time, Planned Production Time, Availability, Performance, Quality and OEE, and the inspected OEE.com TEEP page states TEEP = OEE x Utilization with Utilization = Planned Production Time / All Time. Those are commercial pages, so the governance statements in this article do not rely on them alone. The inspected NIST manufacturing-data publication page describes collecting, curating and re-using manufacturing data from shop-floor equipment, which supports the broader point that production data needs defined meaning before it is reused for decisions. The NIST process-control handbook page was inspected for the general monitoring idea that data should be compared with expected behavior and investigated when it deviates.
No Tuna Industrial Platform capability, customer deployment, software integration, benchmark, ROI claim, certification or live production result is claimed here. The article is written as neutral industrial guidance for manufacturing leaders and operational teams.